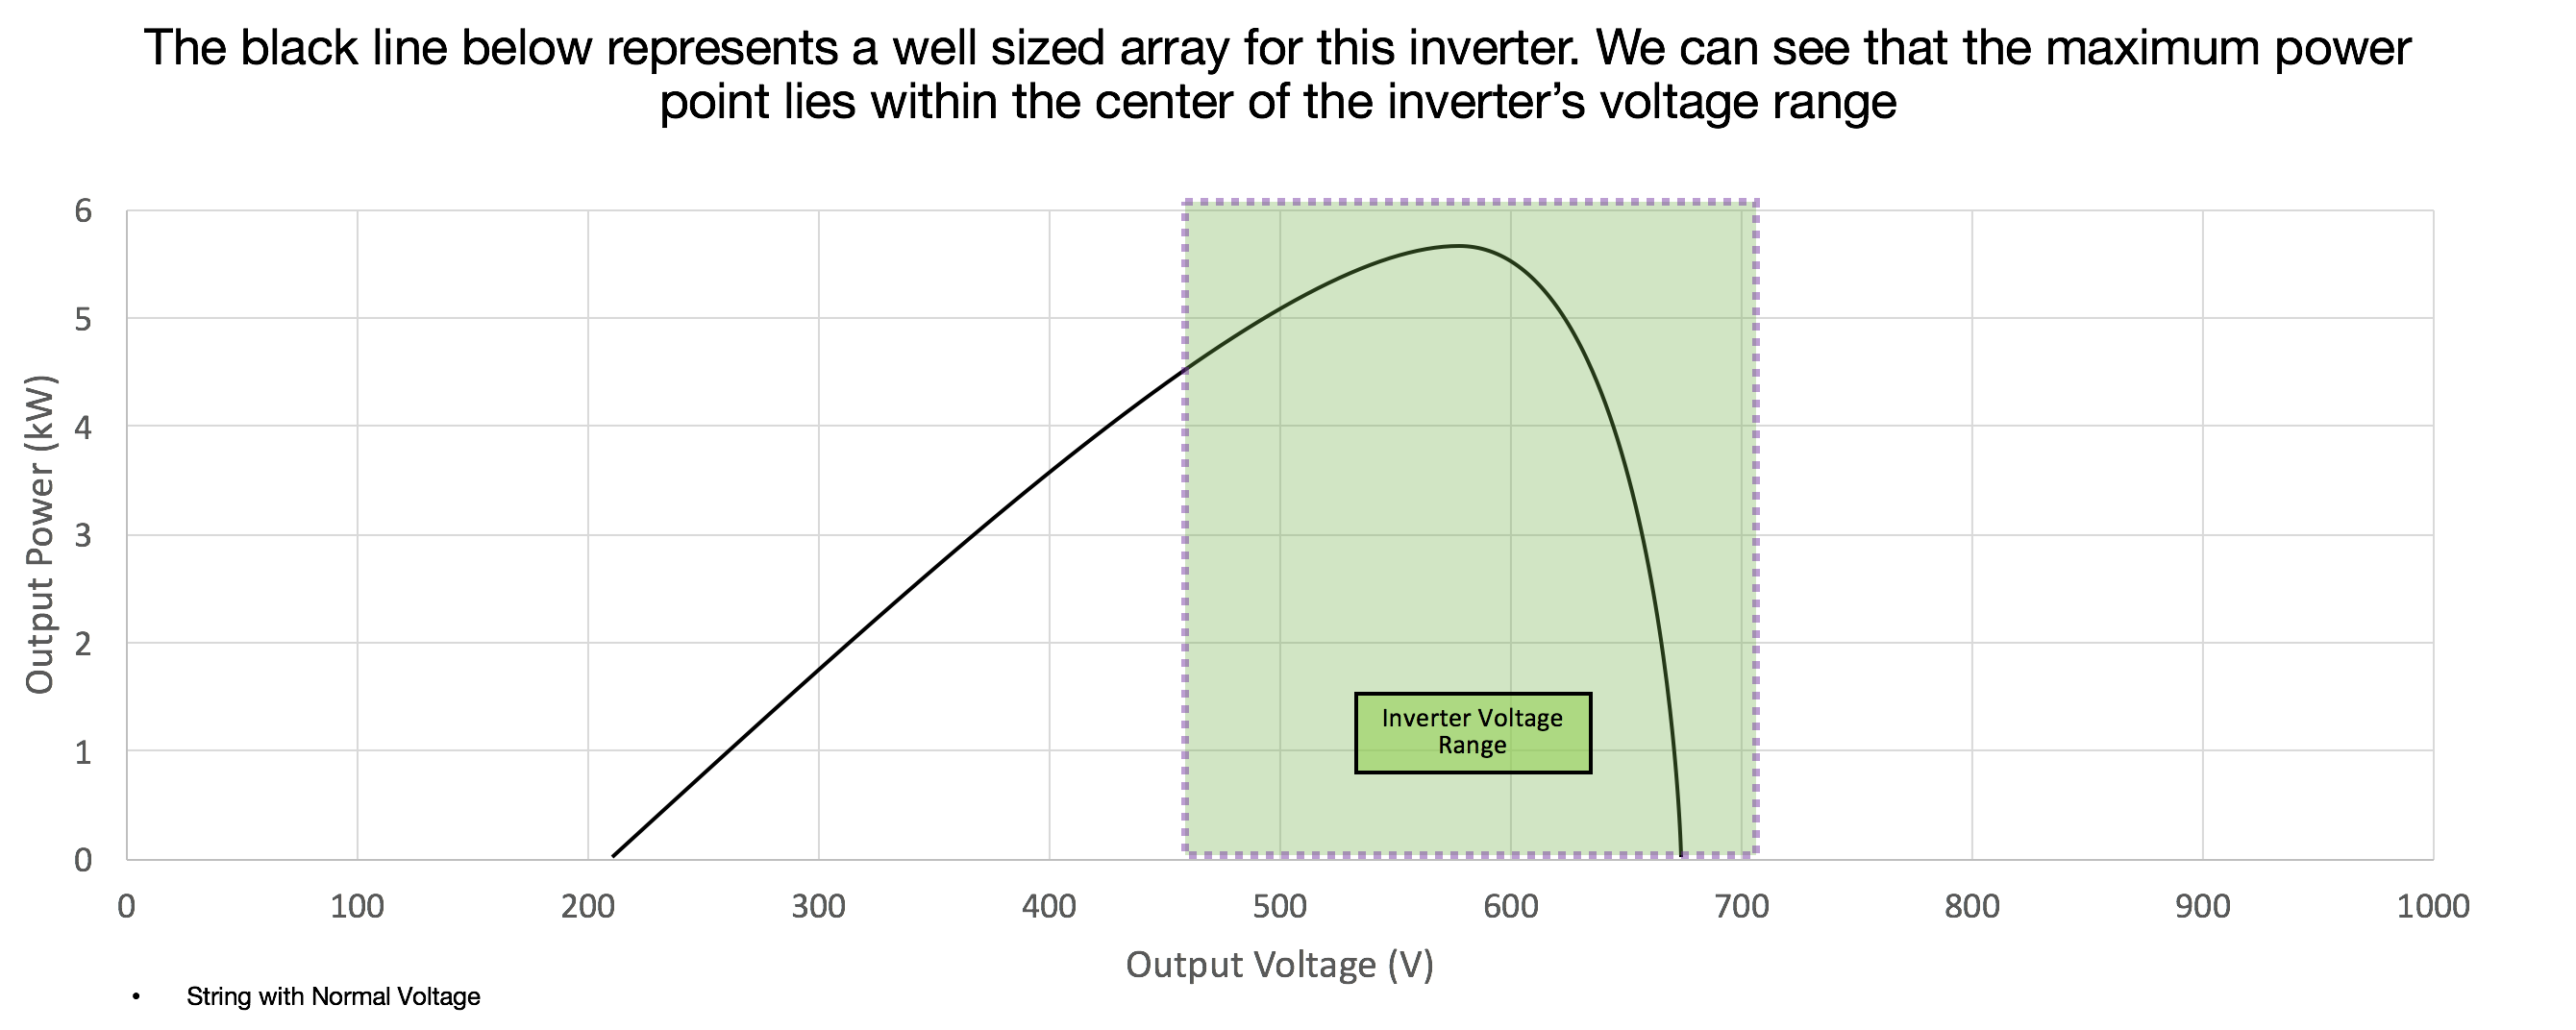
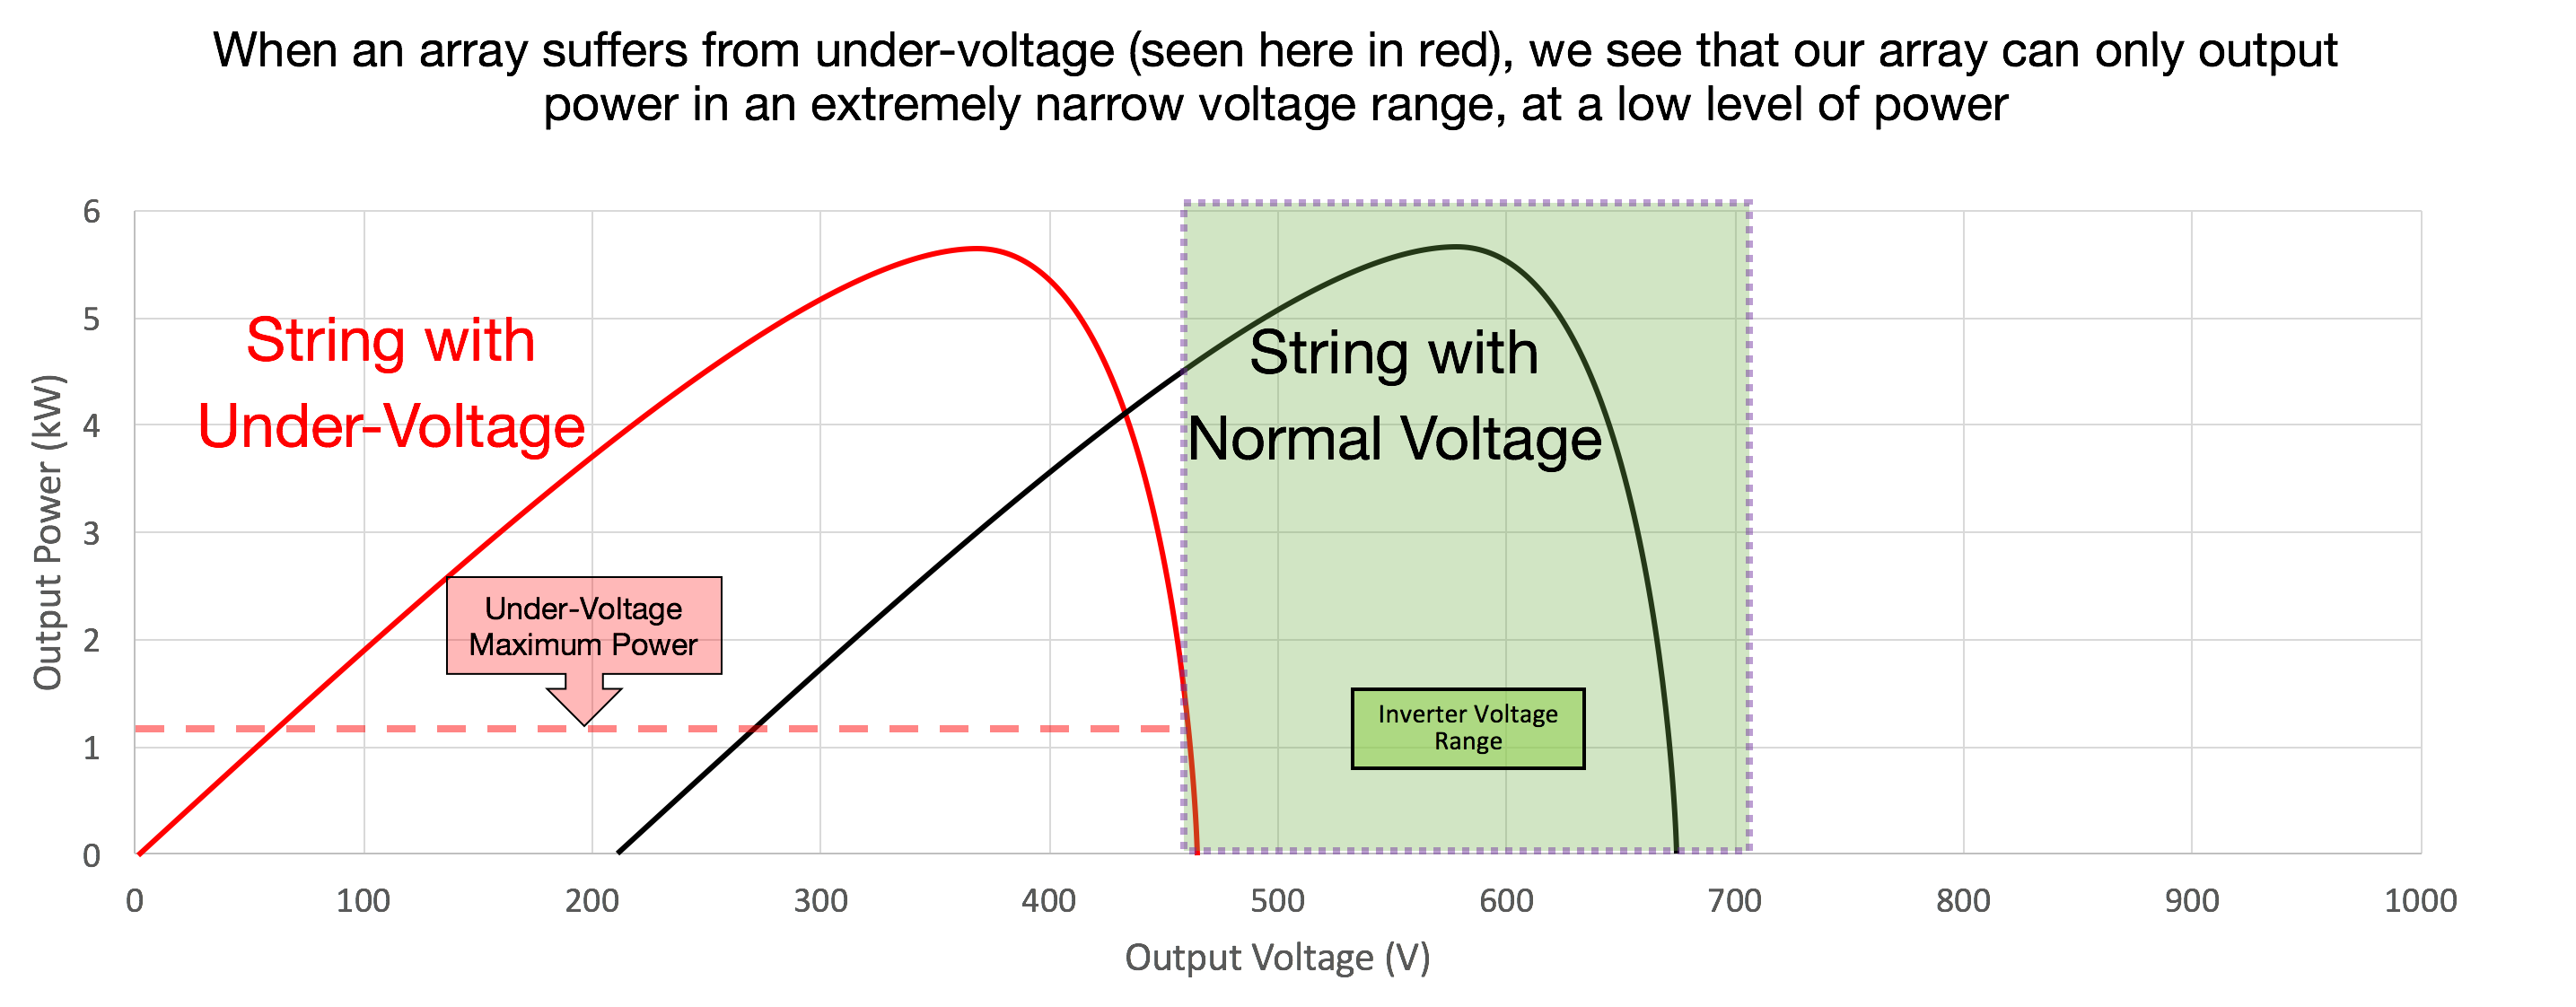
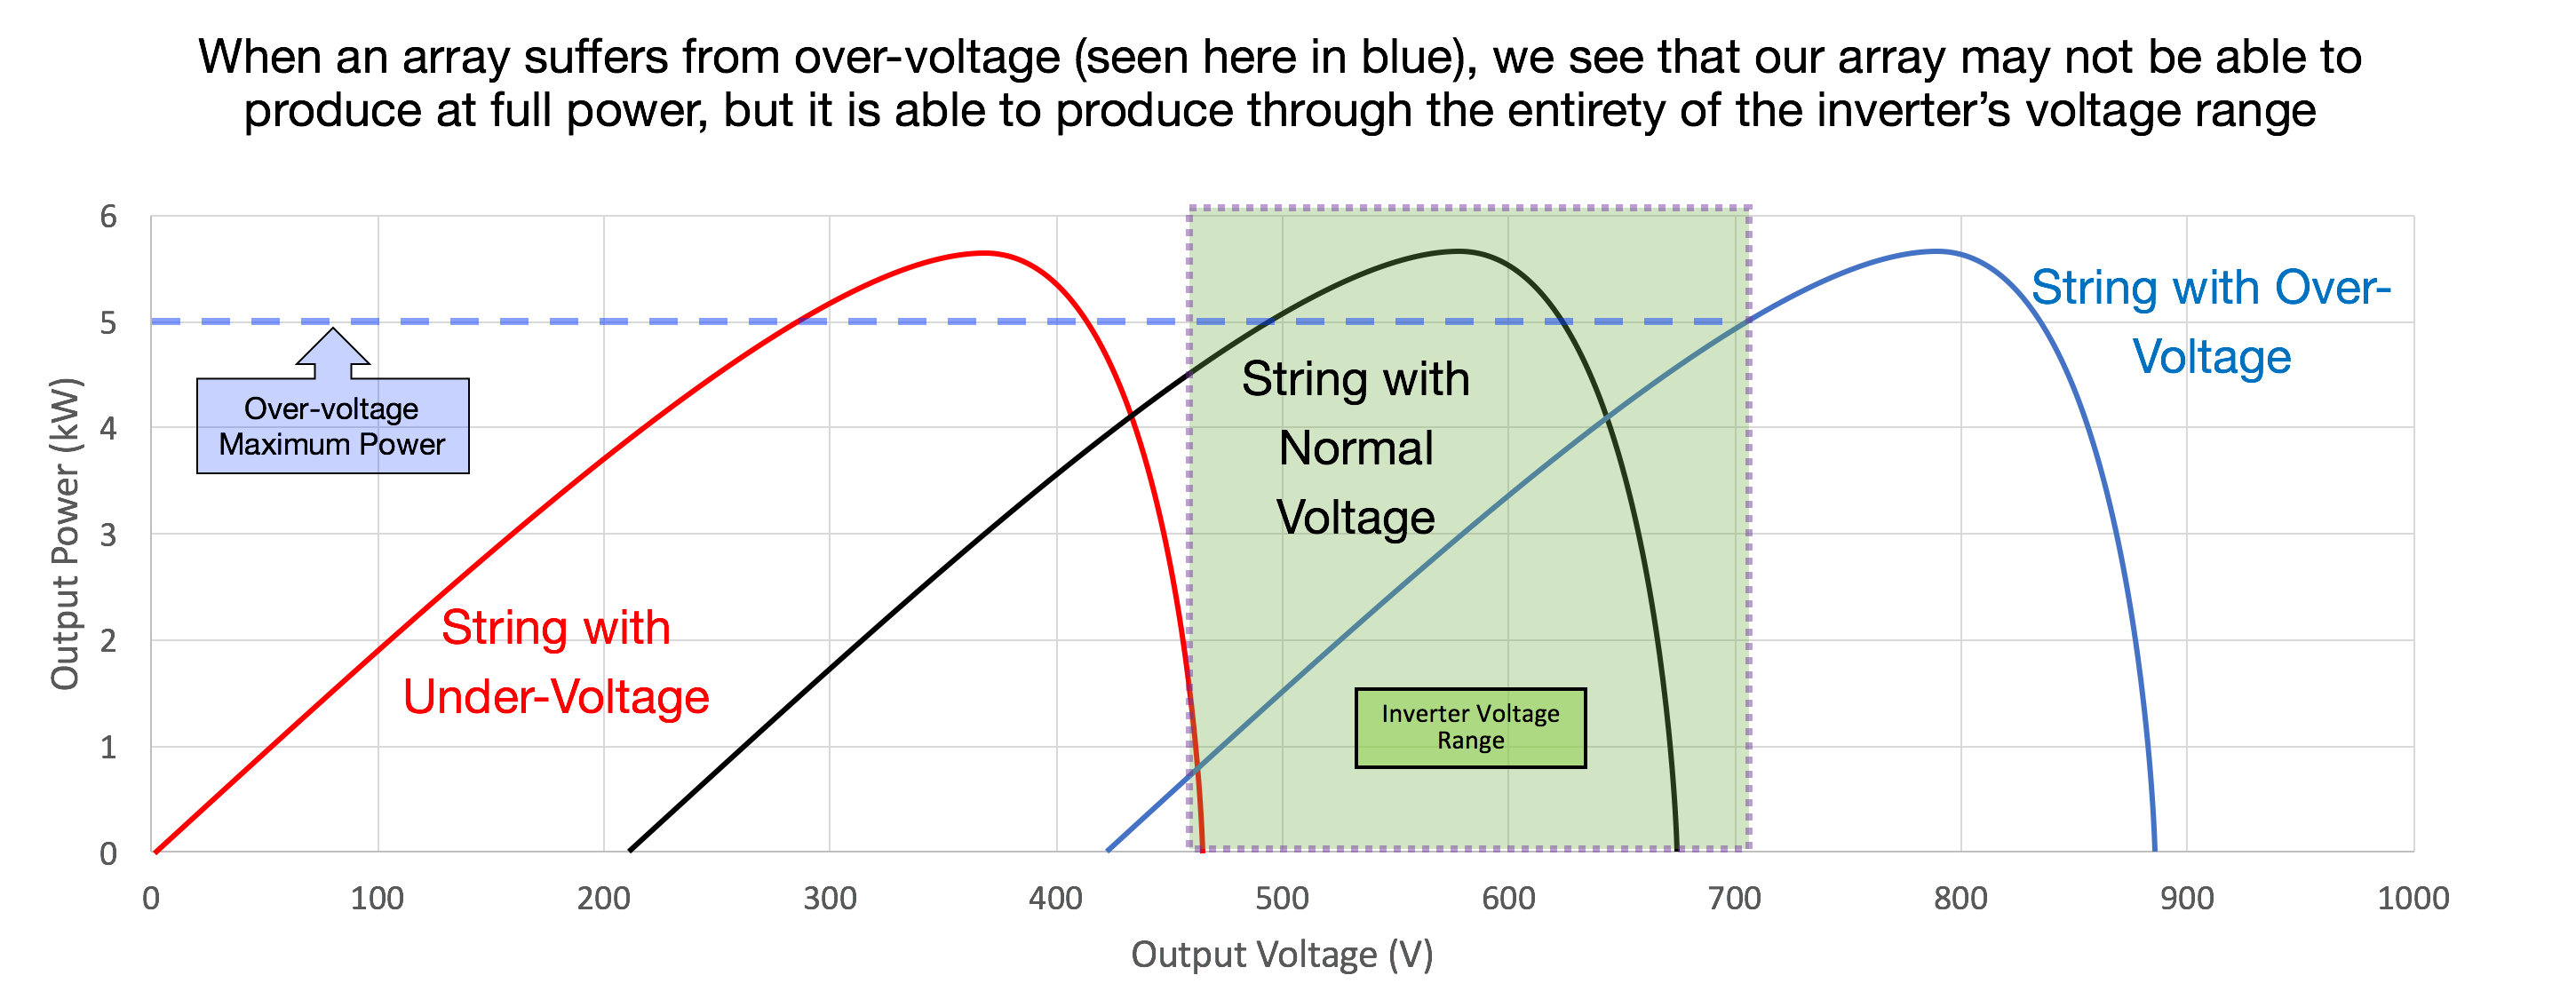
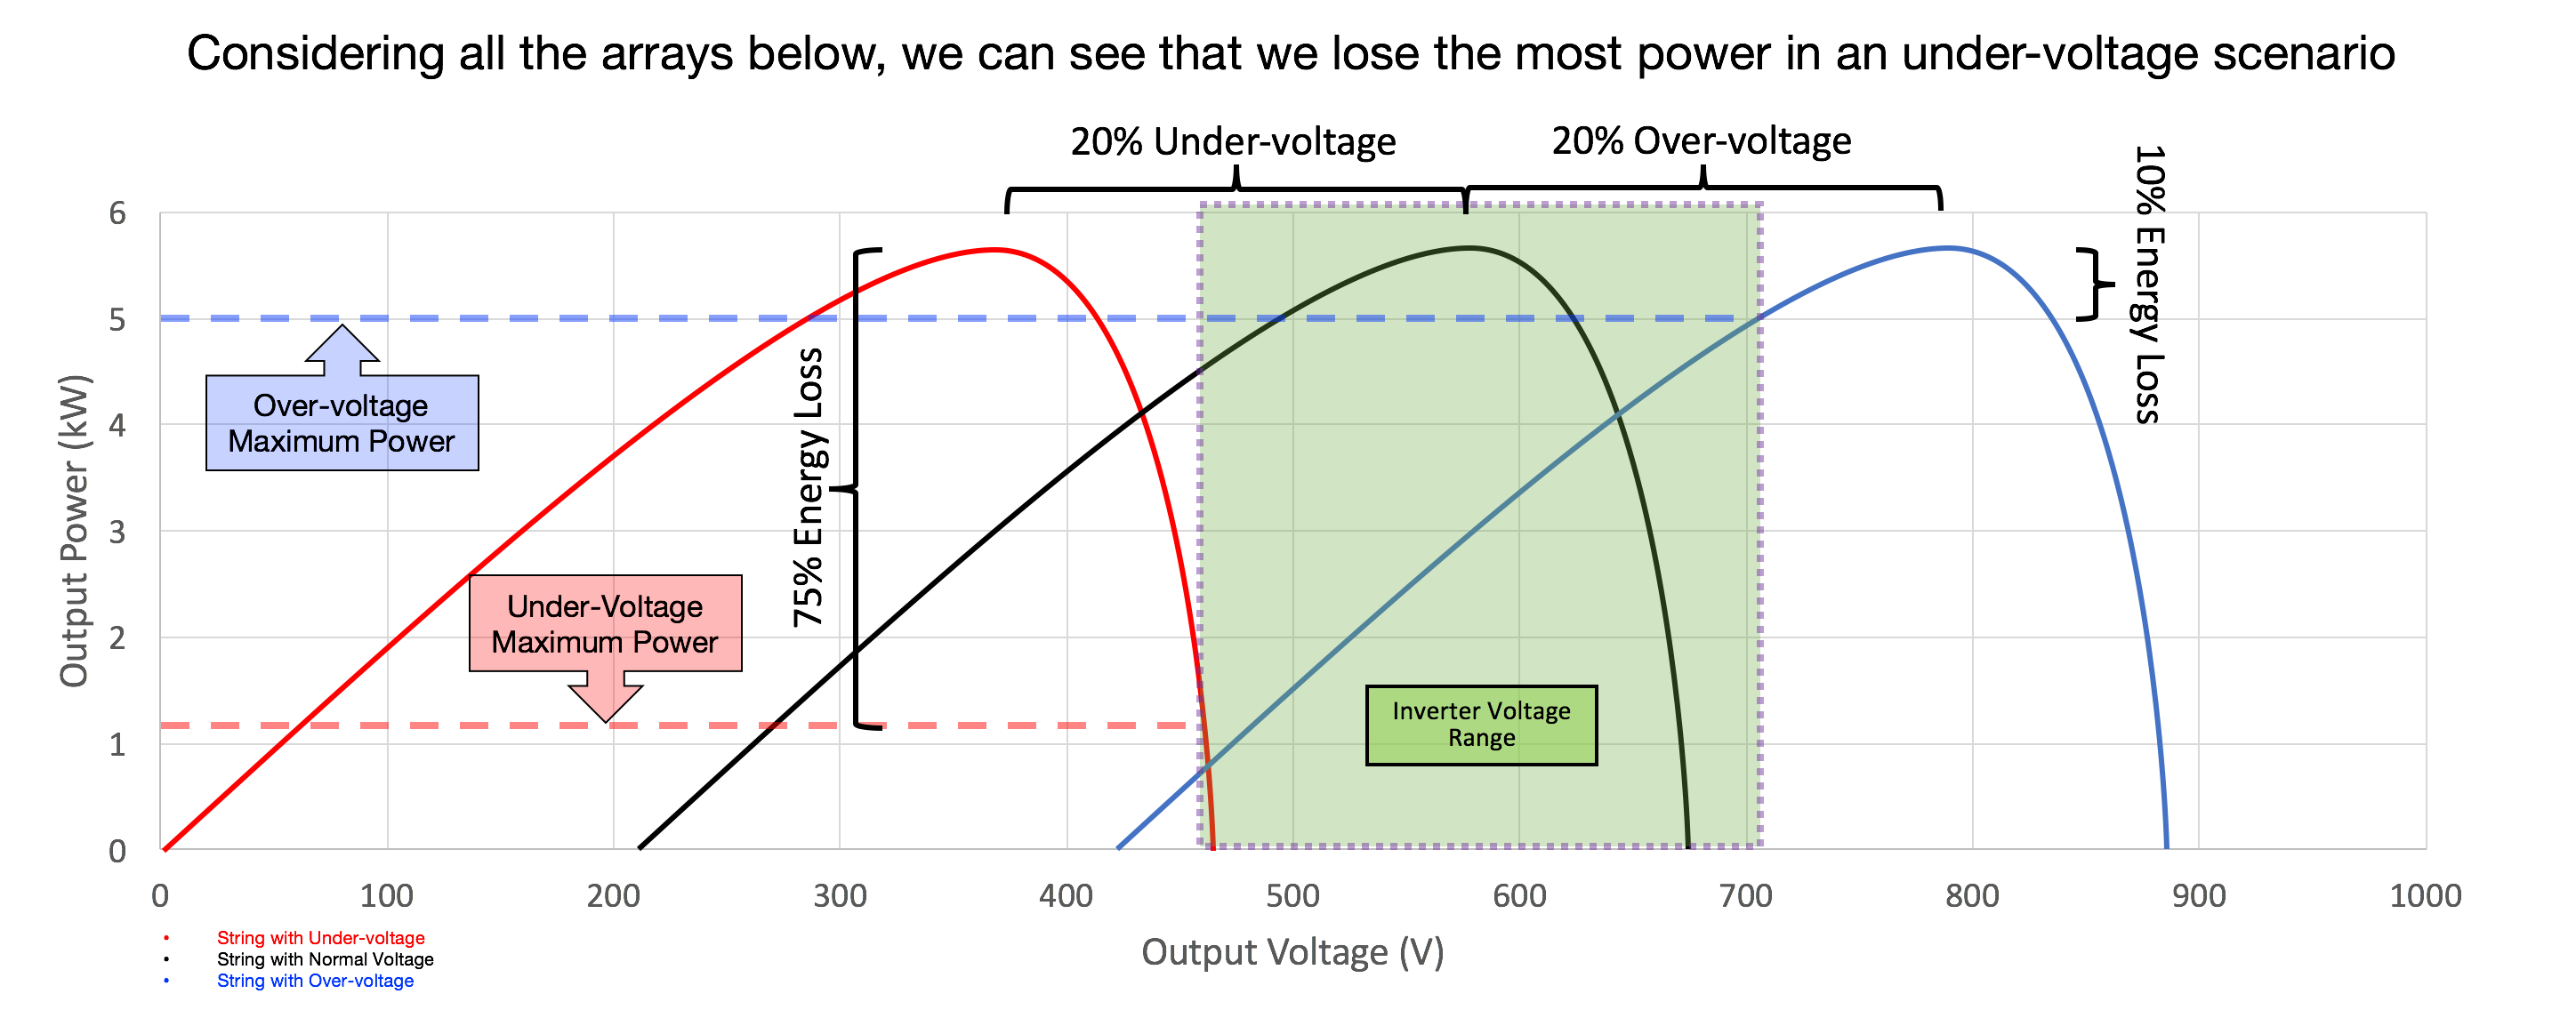
What do Under-Voltage Losses look like?


How can I avoid Under-Voltage Losses?
While we often design to a “Standard” temperature, real-world operating temperatures vary, and can get very hot. Operating temperatures often vary by 40° or more, while datasheets assume a temperate 25°C (72°F).
For this reason, developers often choose to design to NOCT values for a more conservative estimate of production. Arrays with typical Voc values designed to NOCT result in an immediate 8% cut to production, but do not consider losses during hot days at the same time. This means energy will still be lost during days when heat is above STC temperatures.
To avoid under-voltage losses over the lifetime of the project, it can be beneficial to include a design buffer of at least 10-15% greater than your minimum required voltage.
What if I don't design considering Under-Voltage Losses?
When modules degrade, the power loss comes out of voltage. This means that if a design is already at risk of under-voltage clipping, those losses will get worse over time, and will compound on top of the degradation losses. In the example here with “typical” degradation losses, the under voltage clipping reaches 10% in year 10 and almost 22% in year 20.
| Year | Simulated Degradation Losses | Under-Voltage Losses | Degradation X Undervoltage |
| 1 | 0% | 0.3% | 0.3% |
| 2 | 3% | 1.1% | 4.1% |
| 5 | 5% | 2.2% | 7.1% |
| 10 | 7.5% | 5.2% | 12.3% |
| 15 | 10% | 9.8% | 18.8% |
| 20 | 12.5% | 14.5% | 25.2% |
| 25 | 15% | 21.6% | 33.4% |
