What is a Typical Meteorological Year
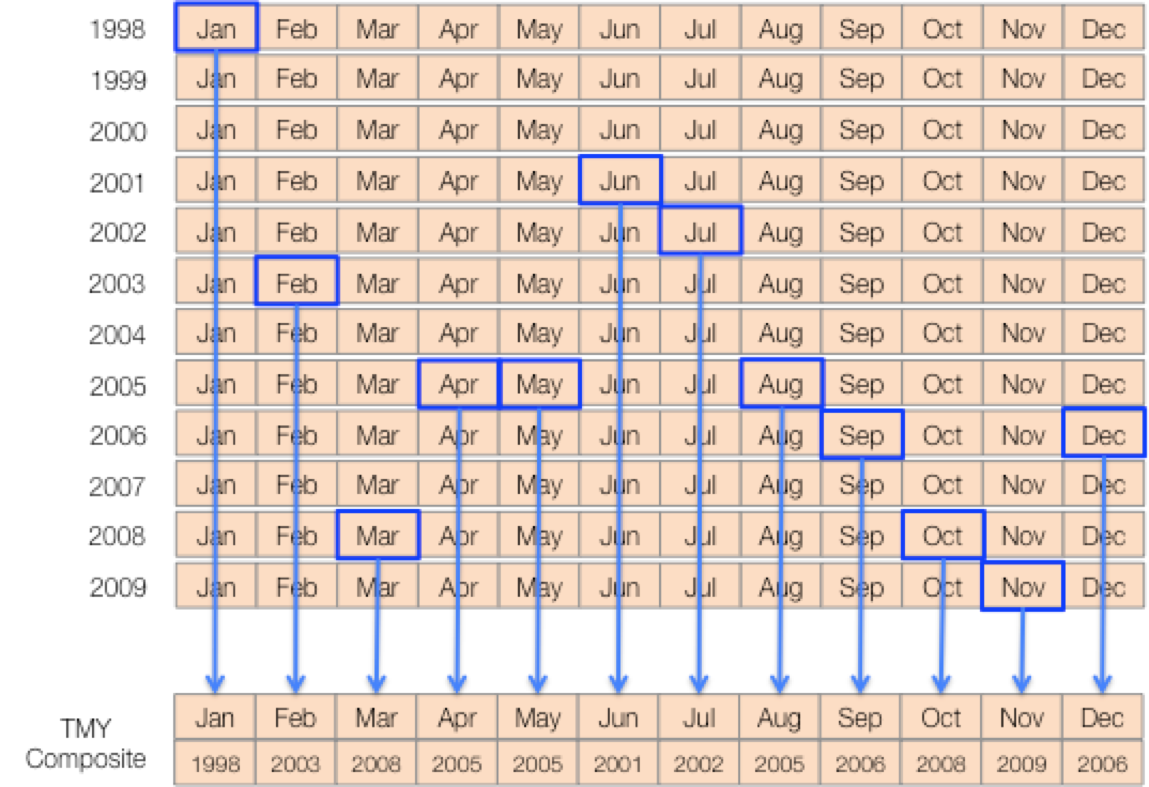
“TMY” weather files are designed to represent a “Typical Year” of weather at a particular location. This is done by looking at a multiple-year history and selecting the most typical data for each month.
How TMY Files are Constructed
Weather stations collect hourly weather data over multiple years (up to 30 years, depending on the source). Certain years may experience extraordinary weather conditions like El Nino. To counter this effect, TMY files, select the most representative year for each month, based on sunlight and temperature. The weather file is then constructed of the most representative months throughout those years. For example, you may have January from 1998 and February from 2003 because those specific data were most representative of the “typical” January and February for that location.

What TMY Files Look Like
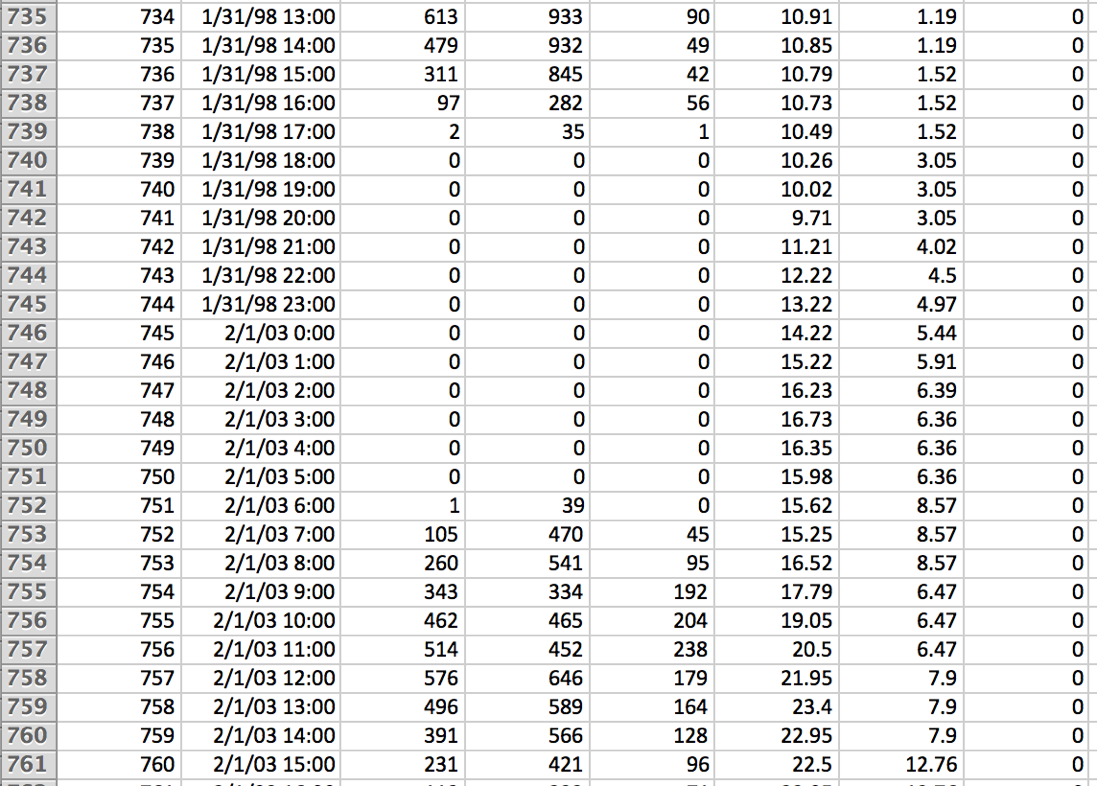
TMY files represent a full year of hourly data, so there are 8760 rows (365 days x 24 hours). The timestamp (column B of the HelioScope CSV output) will show the specific day/year of each reading – and because of how TMY files are constructed, the year will often jump from one month to the next (as can be seen in rows 745-746 below):

Further Reading
For a more in-depth understanding of the TMY3 methodology, see NREL’s TMY3 Handbook: http://www.nrel.gov/docs/fy08osti/43156.pdf
For a high-level discussion of weather calculations, see HelioScope Modeling 101.
For a detailed documentation of the weather and irradiance calculations in HelioScope, see the Mathematical Formulation.
